Nearly half of all fatal July 4th crashes nationwide reportedly involve an alcohol-impaired driver — 47%, according to Wheels Away’s Road Risk Index. With AAA projecting tens of millions of Americans driving over the holiday week, that number isn’t abstract. It’s the car merging onto the interstate after the fireworks end. The Index scores states across six factors: road fatality rates, alcohol involvement in fatal crashes, seat belt compliance, uninsured driver rates, and Google search volumes for “DUI lawyer” and “July 4th car accident” — producing a clearer picture of where holiday driving turns genuinely dangerous. Federal regulators have also been increasingly focused on vehicle safety standards that affect crash outcomes across the country.
South Carolina Tops the Risk Rankings – By a Wide Margin
The Palmetto State scores 5.68 out of 10, pulling well ahead of the nine states that follow it in the rankings.
South Carolina records 19.5 road deaths per 100,000 residents, compared with Massachusetts at 4.9 — a gap that tells most of the story before any other metric enters the picture. Alcohol reportedly factors into 39% of the state’s fatal crashes. With 12.3% of drivers carrying no insurance, a holiday crash can become a financial catastrophe on top of a human one — especially as the average car payment continues to climb. Residents search “DUI lawyer” at a rate of 55.9 per 100,000 in July, second only to Nevada. Seat belt use sits at a respectable 93%, but that positive is outweighed by compounding risk factors elsewhere. The state maintains roughly 41,000 miles of roadway — coastal highways, rural two-lanes, and urban interstates all carrying July 4th traffic at once.
The Full Top 10
Eight states cluster tightly between 4.28 and 4.98 — the differences lie in which risk factors dominate each profile.
- South Carolina — 5.68
- Nevada — 4.98
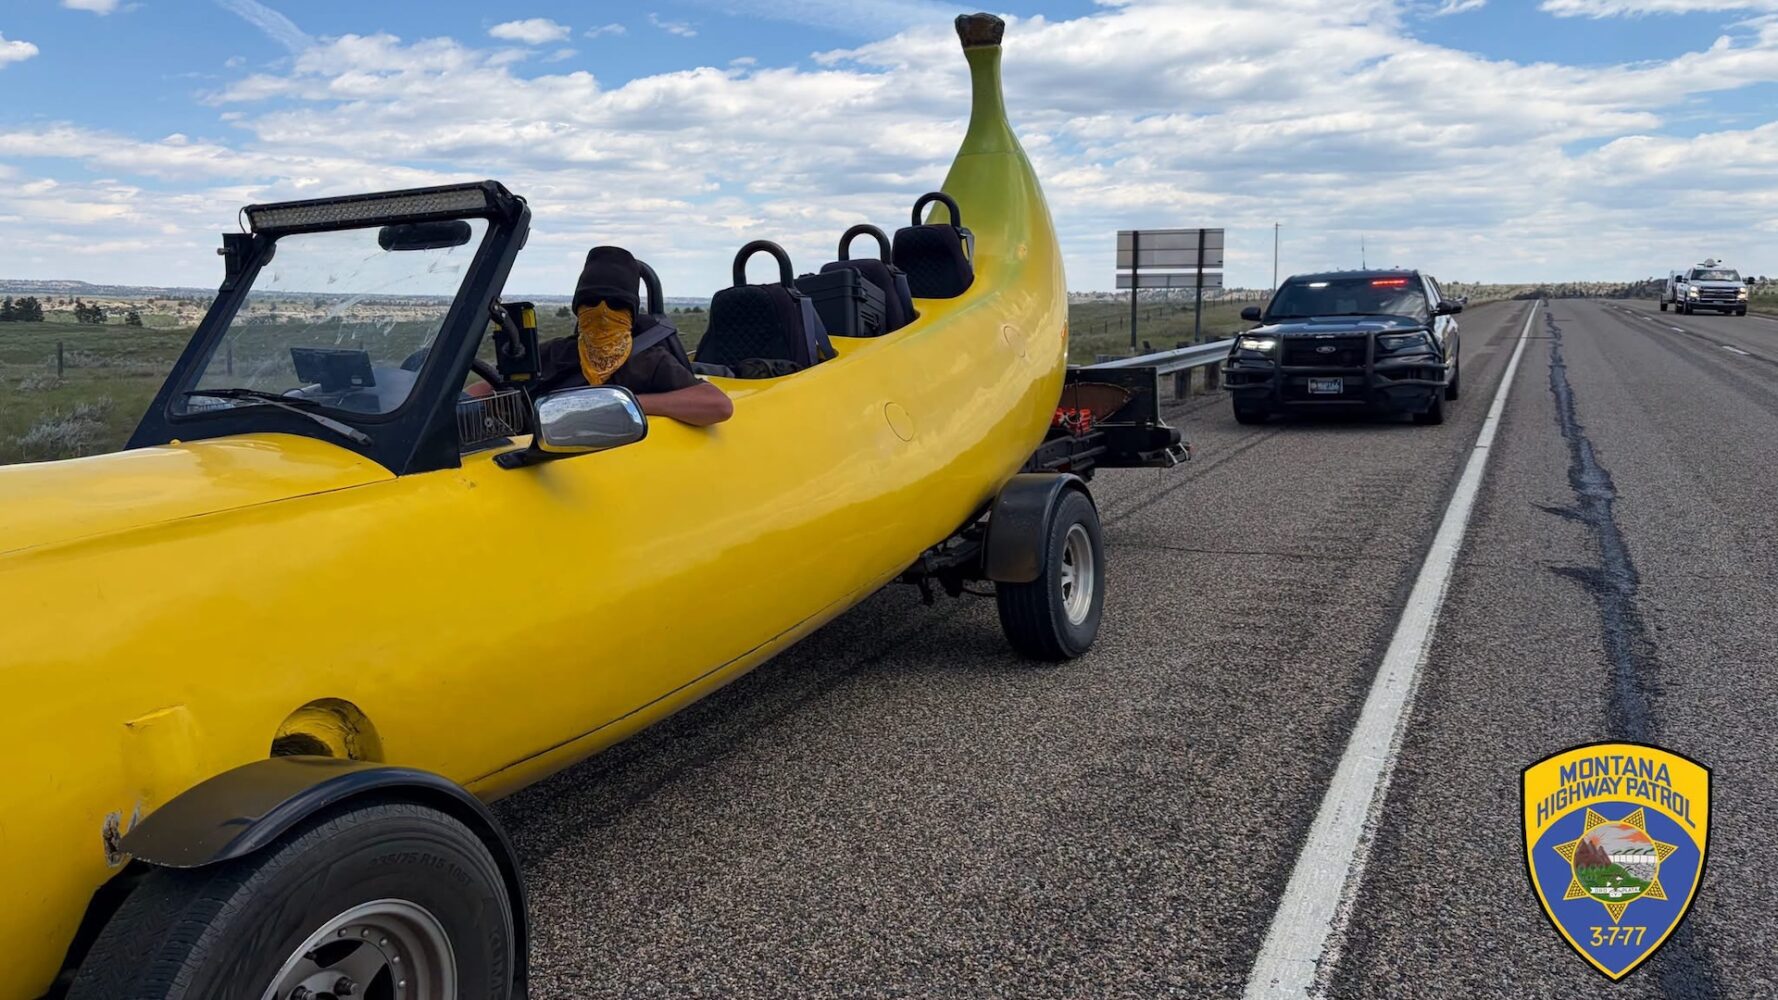
- Montana — 4.86
- Colorado — 4.62
- Arizona — 4.53
- Wyoming — 4.51 (reportedly the highest raw fatality rate in the dataset at 24.7 deaths per 100k)
- South Dakota — 4.48
- Mississippi — 4.43 (22.2% uninsured drivers; 24.9 deaths per 100k)
- Louisiana — 4.40
- Arkansas — 4.28
Nevada’s overall fatality rate is moderate at 12.2 deaths per 100,000 residents. What elevates its ranking is behavioral. Residents and visitors reportedly search “DUI lawyer” at 179.1 times per 100,000 in July — more than double Colorado’s rate of 88.1, the second-highest figure in the dataset. The driver profile there- tourists, late nights, and alcohol close at hand- mirrors the conditions the Index is built to flag.
Montana presents a different risk profile. With seat belt compliance at just 81% — among the lowest rates nationally — and alcohol involved in an estimated 34% of fatal crashes, the state offers little margin for error on a rural road after fireworks. Texas ranks 16th overall but leads all mainland states with 40% alcohol involvement in fatal crashes, a reminder that composite scores don’t always capture every dimension of risk.
The Plan You Make Before You Leave Matters Most
Methodology varies across studies, but the underlying advice remains the same.
Other analyses produce different rankings — Rhode Island tops DUI-specific fatality studies, while Nevada and Montana lead when measuring deaths per vehicle miles traveled. Wheels Away’s index is a composite, and no single metric captures the full picture. What stays consistent is the window of peak danger: late evening, after celebrations end, when roads fill with tired and potentially impaired drivers heading home simultaneously. Choosing cheap cars built for reliability can also make a meaningful difference on long holiday drives.
The danger isn’t random. It concentrates around specific hours, specific behaviors, and — as this data suggests — specific states. Knowing which ones already puts you a step ahead.