

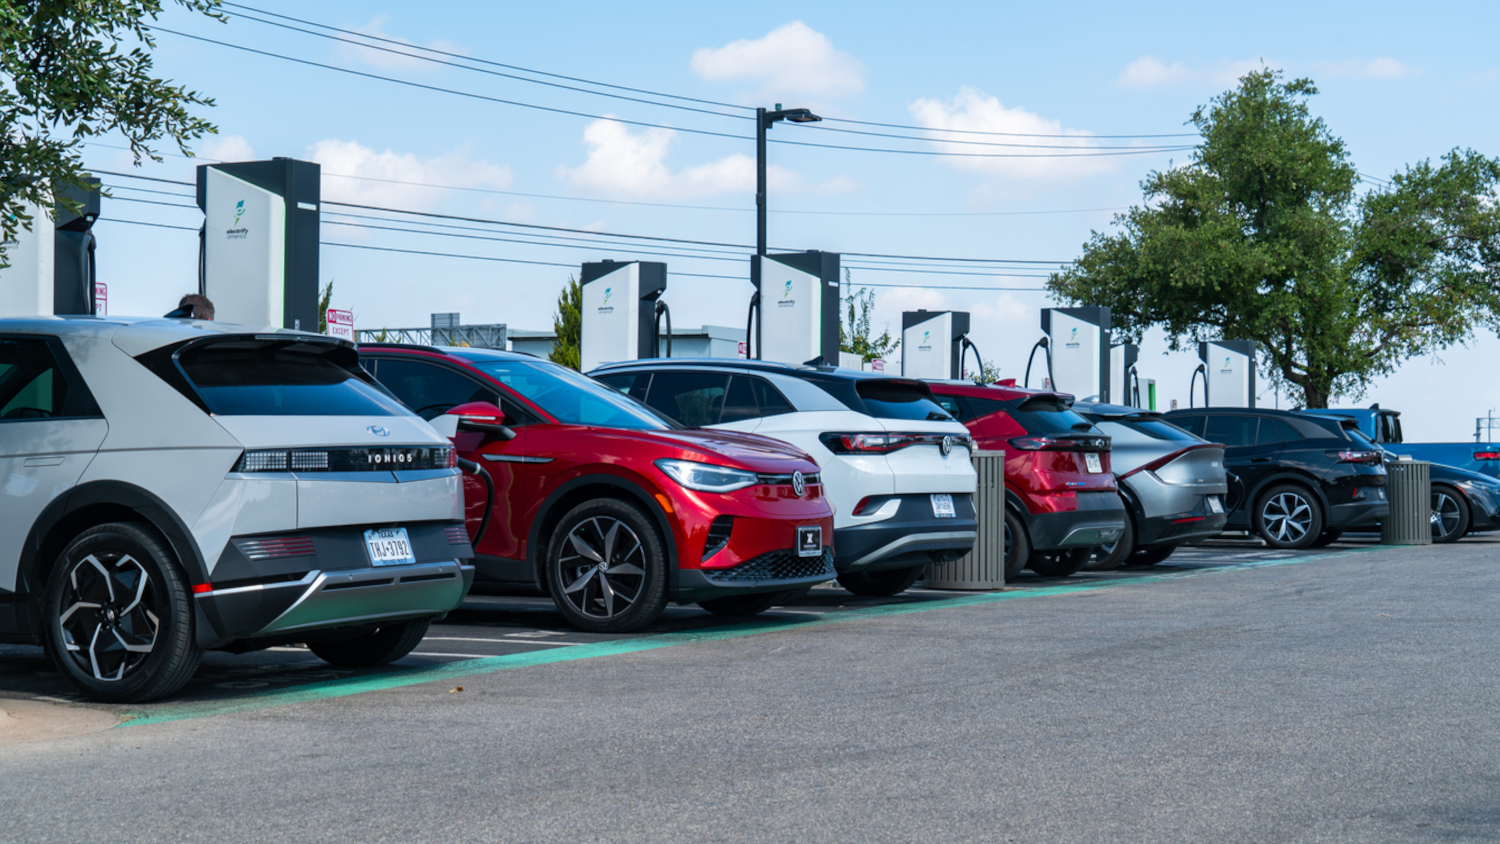
A new iSeeCars analysis of U.S. Department of Energy data across the 50 largest metro areas confirms what savvy buyers already suspect: raw charger counts and real charging access tell very different stories. The findings land at an uncomfortable moment. National charger growth is projected at 15.5% for 2026 — the slowest annual rate since 2011, according to iSeeCars. As infrastructure expansion decelerates, where you live matters more than ever to your daily EV experience.
Los Angeles leads the total count by a margin that borders on absurd. It holds approximately 58 times more chargers than Louisville, Kentucky, which sits at the bottom of the study’s 50-metro ranking with 621. The raw tallies, per iSeeCars:
- Los Angeles: 36,318 chargers
- San Francisco–Oakland–San Jose: 22,430
- New York: 19,036
- Louisville, KY: 621
- Greensboro–Winston-Salem, NC: 700
- Milwaukee, WI: 852
Big city, big numbers. Not exactly a revelation.
The Metric That Actually Matters
Residents per charger separates genuine access from impressive-sounding totals.
Here is where the data gets genuinely useful. San Francisco–Oakland–San Jose leads the study with 334 residents per charger — the strongest ratio among all 50 metros analyzed. Los Angeles, despite its volume dominance, falls to third at 500 residents per charger. Denver and Boston–Manchester both land around 570.
A metro area with tens of thousands of chargers spread across millions of residents can still leave you circling a parking structure on a weeknight. Meanwhile, shoppers weighing a base EV against a hybrid may find that charging access tips the final decision.
The weakest ratios read like a Midwest and Sun Belt cautionary tale:
- Louisville: 2,904 residents per charger
- Indianapolis: 2,758
- Milwaukee: 2,716
- San Antonio: 2,666
A large Sunbelt city with relatively thin charging infrastructure is worth noting before you sign anything.
One important caveat: these rankings count chargers, not uptime, queue length, or whether stations are located near where you actually live and work. The data shows you where to start; your commute tells you where to finish.
Growth Is Real. It’s Also Slowing.
National infrastructure improves heading into 2026, but the pace of expansion is clearly decelerating.
iSeeCars projects 299,798 total chargers nationally by 2026, up from 259,555 in 2025. Residents per charger is forecast to improve from 1,317 to 1,143 — a 13.2% gain. Progress, just not the rapid kind.
Demand pressure is real. California’s MyFirstEV program offers eligible first-time buyers up to $3,500 in instant rebates on new zero-emission vehicles (MSRP $50,000 or less) and up to $1,750 on qualifying used vehicles priced under $25,000. Tesla’s allocated program funds were reportedly exhausted within five days, according to Electrek — a signal of how quickly buyer interest can outpace available support.
Before committing to a purchase, verify live charger availability and connector compatibility through the Department of Energy’s Alternative Fueling Station Locator. Keep in mind that listings reflect reported data and may not reflect real-time conditions at every station. The rankings show you which cities are playing the game. Your daily route determines whether you are winning it.